Sunday, 6 April 2014

Importance of Compression Garments for Diseases

Importance of Compression Garments for Diseases

Mohammad Zain Ul Abideen
B. Sc. in Textile Engineering, Pakistan.
Cell: +92-321-8894390 
E-mail: davilzain@yahoo.com


Compression Garments:
Compression garments are pieces of clothing, such as socks, pantyhose, sleeves, etc., that provide support that is especially useful for people who have to stand for long periods, or people with poor circulation. The garments can come in varying degrees of compression. The higher degrees require a doctor’s prescription. Compression garments worn on the legs can help prevent deep vein thrombosis and reduce swelling, especially while traveling.
Compression Garments for body shape
Compression sportswear is also worn by some athletes during exercise to prevent chafing and rashes, and post-exercise to ease muscle stiffness and quicken recovery time.

Compression garments enhance your curves, control your figure and reduce clothing size in specific areas of your body. Besides, compression garments are widely used in medical textile.
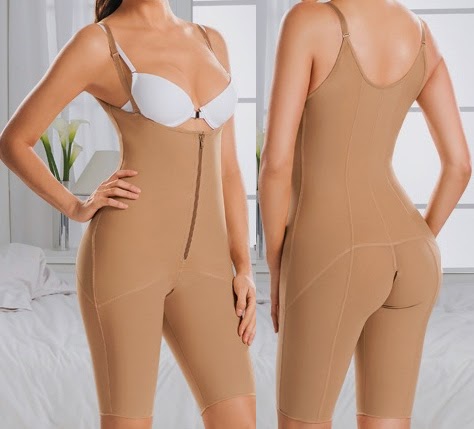
 
Different diseases for which compression garment are necessary:
 
(1) Tired, aching legs:
Occurs when the blood flow slows down in the legs (can be an indicator of deep vein thrombosis).
Compression Garments for injured leg
 (2) Edema (Mild ankle or foot swelling):
When blood and tissue fluid pool in the legs and feet due to poor circulation.
 
(3) Chronic peripheral venous insufficiency:
Veins cannot pump deoxygenated blood to the heart.
 
(4) Varicose veins:
Saccular and distended veins which can expand considerably and may cause painful venous inflammation. Once developed, will not disappear on its own. The formation of varicose veins is an externally visible sign of venous weakness.
 
(5) Spider Veins:
Spider veins (mild varicosities) the smallest cutaneous blood vessels which shimmer bluish or reddish through the skin.

(6) Deep Vein Thrombosis (DVT):
Occurs when blood flow decreases (especially in the lower extremities), causing blood to pool in the legs and leading to blood clot (thrombus) formation.
 
(7) Lymphoedema:
When a body part swells due to an abnormal accumulation of lymph fluid occurring when there is interference with the normal drainage of lymph fluid back into the blood commonly swelling the arm, leg, neck or abdomen.
 
(8) Phlebitis:
Inflammation and clotting in a vein most often a leg vein due to infection, inflammation or trauma. People with varicose veins are more often affected. Inflammation occurs suddenly causing the thrombus to adhere firmly to the vein wall which can clog a superficial vein.
 
(9) Economy Class Syndrome (ECS):
Occurs on long flight due to traveler’s inactivity, gravity and cramped seating which slows down the blood flow through veins.
 
(10) Lipodermatosclerosis:  
Inflammation of subcutaneous fat form of panniculitis.
 
(11)Pregnancy:
Hormones released during pregnancy and the expanding uterus (pressure on the inferior vena cava - the major vein returning blood up to the heart) can affect leg veins.

Compression Garments for pregnancy

Saturday, 5 April 2014

Scope of Quality Assurance and Testing in Spinning

Scope of Quality Assurance and Testing in Spinning
S. M. Hossen Uzzal
B.Sc. in Textile Technology
Monno Fabrics Ltd. Manikgonj
Email: uhossen@gmail.com


Yarn spinning is a process of making or converting fiber materials into yarns. It is a complex branch of textile. Here the task of quality control starts from the raw material. At first when the raw cotton arrives, the lab boys collect samples from each bale and give respective numbers to each bale. Then the samples are tested in H.V.I. machine. From the obtained results, the bales are categorized in suitable categories for bale management and stored in the warehouse. Then the raw cotton is fed to the blow room through the bale management system. The bale management system is a vital task of the Quality Assurance department.

In blow-room, the fibers are opened and cleaned by beaters. Here if over beating takes place then there is a chance of fiber damage. So, the QA department tests cotton sample before and after every beating position to check the cleaning efficiency and fiber damaging. From there, necessary actions are taken. Different wastes that are collected at the fiber deposition plant of blow room are also studied to assure proper removal of trash particles as well as least possible wastage of cotton fiber. Also the QA department monitors the setting and performance of the contamination separator of the blow room.

Blowroom
In the carding machine the Ktex of the produced sliver is checked once per shift. The performance of the carding is evaluated by testing m/c and sliver of the carding in USTER-5 and AFIS. From there the Neps Removal Efficiency, SFCw, SFCn, UQL etc are seen to evaluate its performance and necessity of gauge change, grinding and wire change of cylinder, licker-in and flat is determined. The card sliver is tested in USTER-5 once per shift to test its Unevenness (U%) and coefficient of variation of mass (CV%).
Carding machine
In breaker draw frame, mainly the grain/yd of sliver is tested once per shift. Other than this also the sliver is tested in USTER-5 to determine the length of the fibers in strand to set the proper roller gauge in the roller drafting zone. The breaker sliver is tested once per shift in USTER-5 to determine its Unevenness (U%) and coefficient of variation of mass (CV%).
Draw frame
In lap former, the lap thickness is measured mainly.
The Comber is a very crucial machine. Its performance plays a vital role on the quality of the combed yarn. So, the performance of the comber is assessed by testing the material before and after it. From there the nep removal efficiency of the machine is determined. Also the noil is tested to see whether long fibers are being wasted during the processing. From there, the necessary changes in the setting of the machine is carried out. The grain/yd of combed sliver is checked once per shift. The combed sliver is also tested once per shift in USTER-5 to determine U%, CV% etc and any periodic faults from the spectrogram.

Comber machine
The finisher draw frame is a very vital machine in respect of quality control. As it is the last machine fitted with an auto leveler, it is the last step where the mass variation of sliver can be maintained. For this here the grain/yd of sliver is checked at every hour. If the variation of the finisher sliver can be controlled, then there will be less variation and imperfection in the yarn. Also the calibration of the auto-leveler is done when necessary by the QA department. The finisher sliver is tested once per shift in USTER-5 to determine its U%, CVm%, CV3m% and to see whether there is any periodic fault from the spectrogram.

In case of testing of carding, breaker draw frame and finisher draw frame, a schedule is maintained so that all the machines are tested within a fixed period of time.

In simplex, the hank is mainly tested once per shift. Also the roving is tested in the USTER-5. A schedule is maintained so that all the spindles of simplex machines are tested over a period of time.

Simplex m/c
The yarn of ring frame, rotor machine and auto-coner are tested to determine their count. This test is carried out at each shift for each count and lot. Testing is carried out in USTER-5 Tester in the same manner to determine the U%, CV%, Relative count, +50% thick places, -50% thin places, +200% Neps (ring yarn), Imperfection index, hairiness, standard deviation of hairiness, periodic faults etc. From there necessary actions are taken to eliminate or reduce the faults. The CSP (Count Strength Product) of the yarn are also tested to determine the bundle yarn strength which is very important for knitted fabric. The TPI (Twist Per Inch) of yarn is tested at the beginning of each lot.
Ring frame
The setting of drafting gear in drawing frame, simplex and ring frame is given by the QA department and is implemented then by the maintenance department. The QA department on the basis of trial and experiment does the selection of proper roller gauge and spacer in the drafting zone of simplex and ring frame. Also the setting of the EYC (Electronic Yarn Clearer) is determined by the QA department. This ensures that most of the faults that are present in the yarn are cut out during winding on paper cone and fault free yarn are delivered to the customer.

The moisture content in the yarn packages after heat setting are also tested by the QA department. Thus the proper time of heat setting can be maintained to deliver yarn with required amount of moisture content.


Friday, 4 April 2014

Fiber Cleanliness | Problems Due to Unclean Fiber in Spinning

Fiber Cleanliness:
Fiber cleanliness is one of the important properties of fiber for spinning. Fiber cleanliness includes freedom from excessive fiber finish, debris, and oligomer. The cleanliness of cotton feedstock depends upon the degree of cleaning at the gin, opening, and carding. Cotton fiber ends tend to be damaged by the combing roll and at higher combing roll speeds there is fiber breakage. Cotton fiber generally mixed with …..
Unclean fiber
1. Vegetable matter:
  • Husk portions.
  • Seed fragments.
  • Stem fragments.
  • Leaf fragments.
  • Wood fragments.
2. Mineral material:
  • Earth.
  • Sand.
  • Ore dust picked up in transport.
  • Coal dust picked up in transport.
3. Other foreign matter:
  • Metal fragments.
  • Cloth fragments.
  • Packing materials (mostly polymers).
4. Fiber fragments
  • Fiber particles (which finally make up the greater portion of dust.)
Problems due to unclean fiber:
  1. Metal parts cut the fibres and harmful to spinning machine.
  2. Vegetable matters make disturbance in drafting.
  3. Vegetable matters jam the carding pin.
  4. Mineral matters decay the rolling parts of machine.
Scale of Cleanliness:

Trash (%)
Fibre Quality
Up to 1.2%
Very clean.
1.2%-2.0%
Clean.
2.0%-4.0%
Medium Clean.
4.0%-7.0%
Dirty.
7.0% above
Very Dirty.

What is Hosiery | Dfferent Types of Hosiery

An Overview of Hosiery
Afsana Rahman
Dept. of Fashion Design
KCC Women’s College (Affiliated by Khulna University)
Khulna, Bangladesh
Email: pakhirahman123@gmail.com


What is Hosiery?
The term “hosiery” specially refers to knitted coverings for the feet and legs. But it may generically be applied to all types of knitted goods and fabric. Most hosiery articles are knitted with integral tubular legs and feet on small diameter circular machines. The welt and top are usually knitted first, then the welt and top are usually knitted first, then the foot and toe are knitted. Closing the toe also produces a secure finish.It is widely used as undergarment.
Hosiery
Manufacturing process of hosiery
Types of hosiery articles:
‘Hosiery’ goods are knitted articles for feet and legs. The hosiery articles are of the following 5 types-

Hose: hose have a leg-length extending above knee.
Hose
Three quarter hose: three-quarter hose has a knee length which is approximately twice the foot length.
Three quarter hose
Men’s half hose: men’s half hose are usually in two leg length ranges of between 7 and 9 inches or between 11 and 15 inches.
Men’s half hose:
Tights: tights have a body section which is composed of the same knitted structure as the leg sections and is worn over briefs or panties. They have an elastic waist band.
Tights
Panty-hose: which are designed to replace brief and are worn as an integral underwear and leg-wear garment.
Panty-hose
Stockings: stockings are designed to fir the leg up to or above the knee and may or may not be self supporting.
Stockings
Classes of hosiery machines:
Except for few Griswold type hand-turned machines, all hosiery machines are of rotating cylinder type. There are mainly 3 types of hosiery machines:

1. Single cylinder hosiery machine.
Single cylinder hosiery machine.
2. Cylinder and dial hosiery machine.
Cylinder and dial hosiery machine
3. Double Cylinder hosiery machine.
Double Cylinder hosiery machine

Wednesday, 2 April 2014

Application of Nano Technology in Textile Wet Processing

Application of Nano Technology in Textile Wet Processing
Aravin Prince Periyasamy
Asst Professor, Dept of Textile Technology,
DKTE Textile Engineering Institute, Kolhapur, India
E-mail: aravinprince@gmail.com


Characteristics of Nano finished Textile materials

  • Their protective layer is difficult to detect with the naked eye.
  • Saving time and laundering.
  • This technology embraces environmental friendly properties.
  • The crease resistant feature keeps clothing neat.
  • Nano processed products are toxic free
  • Garments are good looking and more durable than ordinary material
  • Manufacturing cost is low, adding value to the products.
Application of Nano Technology in Wet Processing:
1. Nano dyeing


2. Nano finishing
  • Hydrophobic finish
  • Self cleaning effect
  • UV-protection
  • Anti-Microbial
  • Anti-Pollen
  • Odour fights finish
  • Flame retardant finishing
Nano dyeing:
Nano dyeing is done for the following reason.
  1. 1To reduce the electricity,heating ,process time in cotton textile dyeing process.
  2. To reduce the water quantity in cotton textile dyeing process.
  3. To decolorized the effluent water less TDS out , with textile drain itself.
  4. This process do not required any other harmful chemicals.
  5. Begin to earn big money on process time .
Nano Finishing: Hydrophobic Finish
  • This nano finish originally named as “Nano care”& marketed by “Nano Tex”
  • Hydrophobic surface can be produced mainly in 2 ways
  • By creating rough structure on a hydrophobic surface
  • By modifying a rough surface using materials with low surface energy
  • Fluro carbon finishes constitute an important class of hydrophobic finish
U-V Finish
  • Rayleigh‟s scattering theory predicts that in order to scatter UV radiation between 200 and 400 nm, the optimum particle size will be between 20 and 40 nm.
  • A thin layer of titanium dioxide is formed on the surface of the treated cotton fabric which provides excellent UV-protection; the effect can be maintained after 50 home launderings.
    Treated cotton                                                            Un treated cotton
Anti Microbial Finish
  • It is a well known fact that the growth of bacteria and microorganisms in food or water is prevented when stored in silver vessels due to antimicrobial properties
  • Silver nano particle
  • Silver ions have broad spectrum of anti microbial activities
  • The method of producing durable silver containing antimicrobial finish is to encapsulate a silver compound or nano particle with a fiber reactive polymer like poly (styrene co-maleic anhydride)
  • Instead of perfume , we may use thermo sensitive pigment, thermal storage materials or pharmaceutical preparation in the inner core
  • The treated yarns showed effective antimicrobial activity against various bacteria, fungi
Anti-Pollen Finish
  • Miyuki keori co of Japan is marketing anti-pollen fabrics
  • The smoothness of the finish on the surface and the anti-static effect does not let pollen or dust to come close
  • This finish is given by the polymer which have anti-static or electro conductive composition, Eg. Fluroalkyl –( meth acrylate polymers.)
  • It is used in coats blouses, gloves,& etc
Odour Fight Finish
  • A Taiwanese nano-tech firm Green shield has created underwear using nanotechnology that fights odour.
  • This underwear fiber release undetectable negative ions & infrared rays that destroy odour -causing bacteria.
  • The negative ions inhibits the reproduction of bacteria
  • Far infrared rays causing all the individual atoms being vibrated at a higher frequency which speeds up the metabolism & the elimination of wastes
  • Tourmaline –a natural mineral emits negative ions when low level radiation comes in contact with oxygen, co2 & water molecules in the air-promotes electrolytic dissociation.
  • This nano finish can eliminate
  • 99.99% of bacteria,
  • 90% of odour,
  • 75 % sticky moisture
Flame-Retardant Finish
  • Nyacol nanotechnologies, has been the world leading supplier of colloidal Antimony pentoxide which is used for flame retardant finish on textiles.
  • It contain colloidal antimony pent-oxide with halogenated flame retardants. The ratio of halogen to antimony 5:1 to 2:1 
  • 10 parts of nycolin 1550 parts of aqueous dispersion, with pH7 and add 40 parts of H2O and sufficient ammonia add for bring out pH9, mix this with 50 parts of rubber latex and spray to the Non-woven material. 
 

Tuesday, 1 April 2014

Estimation of Scouring Effect by Weight Loss and Absorbency Test

Estimation of Scouring Effect by Weight Loss and Absorbency Test

Mustaque Ahammed Mamun
Department of Textile Engineering
Dhaka University of Engineering & Technology (DUET)
Cell: +8801723300703 
Email: mamuntex09@gmail.com


Introduction
Scouring is the process by which oil, wax, fat are removed from fabric. So that fabric weight will be reduced slightly ( in case of good souring 4%-8%) and absorbency of fabric will be higher for removing of oil, wax, fat etc. Absorbency test are determined by Drop test, Spot test, Immersion test and column test.

Objectives
  • To know about the scouring process.
  • To know about the estimation of scouring effect.
  • To know about the weight loss and absorbency test.
  • To know about the process of estimation.
At first fabric have to be Scoured. Before souring oven dry weight (1050c x 10′) have to be measured and recorded.

Scouring Recipe
  • NaoH————————————————— 7 gm/L
  • Na2CO3 ——————————————— 3 gm/L
  • Detergent ——————————————- 1 gm/L
  • Sequestering agent ————————— 1 gm/L
  • Wetting agent ———————————— 1 gm/L
  • M t L —————————————————1 t 10 
  • Temp x time —————————————900c x 30′
Calculation
Sample weight = 9.311 gm.


Total liquor = 9.311 x 10 = 93.11 ml


Water = 93.11- (6.5+2.8+1+.1+.1) = 82.61 ≈ 83 ml

After scouring oven dry weight (1050c x 10′) have to be measured and recorded.

ESTIMATION OF SCOURING EFFECT

1. Determination of Weight Loss


Standard range of weight loss= 4-8%

So it is( 5.48 %) moderate scouring

2. Absorbency Test

a. Immersion Test
Test: sample of ( 1 x 1)cm2 size is cut and it is left on water surface. With the help of stop watch, the time of the fabric for immersing is recorded.

The standard time of immersing is 5sec.

Expt. Sample immersing time is 4.75 

Also moderate scouring.

b. (i) Drop Test
In a pipet water is taken and water drop are dropped on the scoured fabric and the absor-ption of the water drop is observed visually.

The standard time for the absorption of one drop is 0.5-0.8 sec upto 1 sec.

Expt. Sample require 6 sec. i.e. not good scouring

(ii) Spot test
In a pipette a solution of 1% direct red (Congo red) is taken and droplet of solution put on the different places of the fabric. Then the shape of the absorption area on the fabric is observed.


From Sample Spot uniform scouring can be said.

C. Column Test / Wicking Test:
  • 18cm x 5 cm sample is cut from scoured sample
  • In a beaker 1% direct dye red color is taken
  • After that a marker is drawn at 1cm above from the sample bottom.
  • Now the sample is hung from a wood stick supported by immersing that 1cm portion of fabric in the dye liquor
  • Then we measured the point upto which the colored solution in absorbed straight above way by the sample in 5 min time.
Column Test Result:
Standard range 30-50 mm.
Expt. Sample Average range is 30 mm

Result and Discussion
For shortage of scouring time souring have been medium to good.

At last we can say that, how to estimate of scouring effect is known by this experiment. Knowledge is gained from this experiment which is very helpful in our practical life. Special thanks to our teacher who has been help us to complete this experiment.

Estimation of Bleaching Effect on Cotton Fabric by Measurement of Reflectance

Estimation of Bleaching Effect on Cotton Fabric by Measurement of Reflectance

Mustaque Ahammed Mamun
Department of Textile Engineering
Dhaka University of Engineering & Technology (DUET)
Cell: +8801723300703 
Email: mamuntex09@gmail.com


Introduction
Bleaching is the process by which natural color of cotton fabric aredestroyed. So that fabric will be more bright& light reflectance will be more before one. Also absorbency is increased because sodium hydroxide is used to increase the pH value and which remove oil, fat wax etc. The bleaching effect is measured by two ways-
  1. Measurement of reflectance.
  2. Measurement of whiteness.
Measurement of whiteness in case of hypochlorite bleaching.But we used hydrogen peroxide so we will measured only Measurement of reflectance.

Objectives
  • To know about the bleaching process.
  • To know about the estimation of bleaching effect.
  • To know about the Measurement of reflectance.
  • To know about the process of estimation.
At first fabric have to be Bleached.

Bleaching Recipe:
  • H2O2————————————————-9gm/L
  • Stabilizer ——————————————- 4.5 gm/L
  • NaoH ———————————————— 8 gm/L
  • Na2CO3 —————————————— 5gm/L
  • Detergent —————————————— 1 gm/L
  • Anticreasing —————————————1 gm/L
  • Sequestering agent —————————- 1 gm/L
  • Wetting agent ———————————— 1 gm/L
  • M t L ————————————————-1 t 10 
  • Temp x time —————————————1000c x 30′
Calculation:

Sample weight = 9.64gm

Total liquor = 9.64 x 10 = 96.4 ml

Water =96.4- (8.676+4.338+7.112+4.82+1+1+1+1) = 67.454≈68 ml

ESTIMATION OF BLEACHING EFFECT
Measurement of Reflectance: when a fabric is bleached, its light reflecting capacity increases. The reflectance of a bleached fabric is measured by spectrometer. It can measured light reflectance of fabric and can give reflectance curve.


Standard range of reflectance 85% (84%-86%) up to 90%.

A range of 90-94% reflectance is also possible in a high temperature treatment in a kier (120oc). In high temperature bleaching, we can get high range of bleaching but high temperature bleaching is a risky.

Reflectance Curve & % of Reflectance:
Figure: Reflectance curve & % of Reflectance
We see that from above chart of reflectance of scoured and non-scoured sample are increased at small amount. And amount of hydrogen per-oxide reflectance are increased respectively but we see that there are vary difference of last person experiment i.e. amount of hydrogen per-oxide 11gm/L used and reflectance is less than from all but there would be more reflectance from others. So I think that there may be problem in his experiment. So we should that, more attention have to be maintain during experiment.

Also in most case, scouring is above 85 at 700 nm which can be said good scouring.

Conclusion
At last we can say that, how to estimate of bleaching effect is known by this experiment. Knowledge is gained from this experiment which is very helpful in our practical life. Special thanks to our honorable teacher who has been help us to complete this experiment.